Linked data as graphs
When you link data, the results can be thought of as a graph, where each record (node) in your data is connected to other records by links (edges). This guide discusses relevant graph theory.
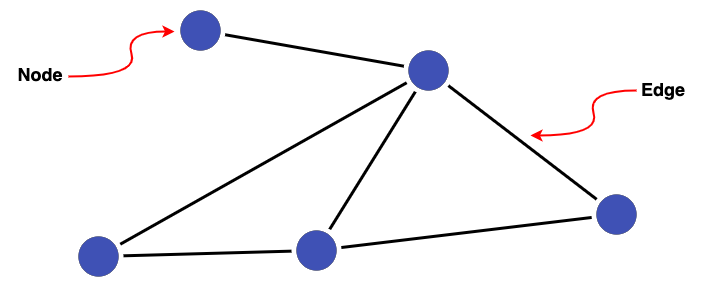
A graph is a collection of points (referred to in graph theory as nodes or vertices) connected by lines (referred to as edges).
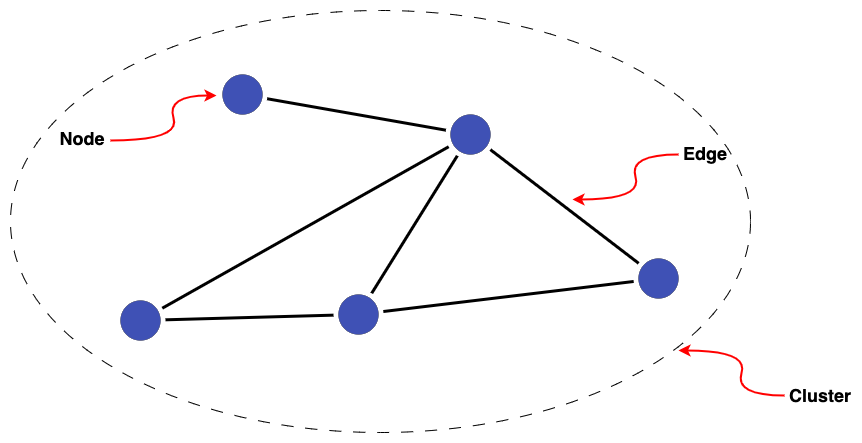
Then a group of interconnected nodes is referred to as a cluster.
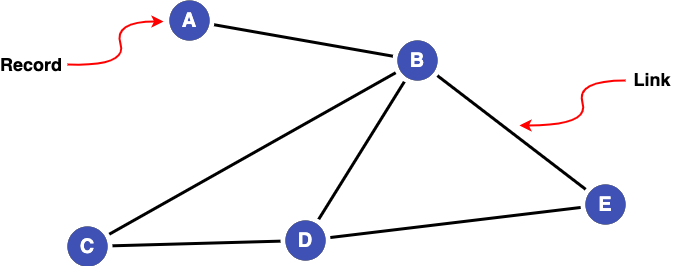
Graphs provide a natural way to represent linked data, where the nodes of a graph represent records being linked and the edges represent the links between them. So, if we have 5 records (A-E) in our dataset(s), with links between them, this can be represented as a graph like so:
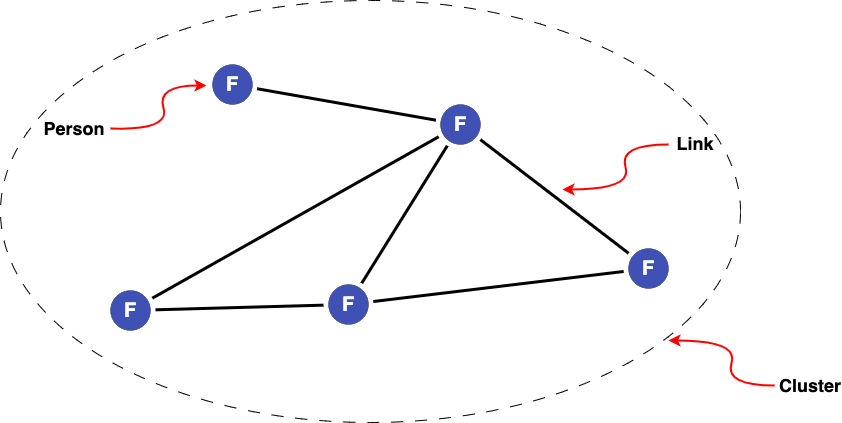
When linking people together, a cluster represents the all of the records in our dataset(s) that refer to the same person. We can give this cluster a new identifier (F) as a way of referring to this single person.
Note
For clusters produced with Splink, every edge comes with an associated Splink score (the probability of two records being a match). The clustering threshold (match_probability_threshold) supplied by the user determines which records are included in a cluster, as any links (edges) between records with a match probability below this threshold are excluded.
Clusters, specifically cluster IDs, are the ultimate output of a Splink pipeline.
Probabilistic data linkage and graphs
When performing probabilistic linkage, each pair of records has a score indicating how similar they are. For example, consider a collection of records with pairwise similarity scores:
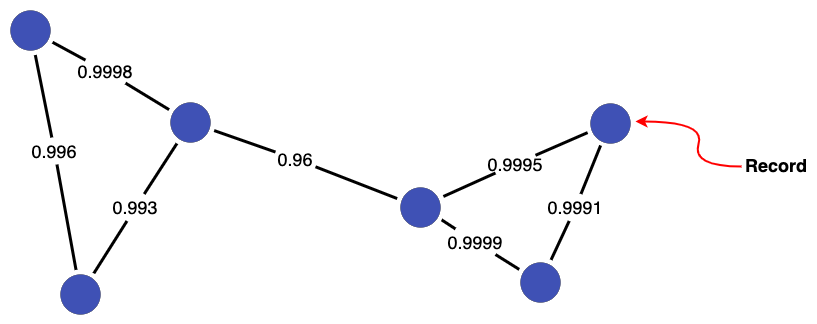
Having a score associated with each pair of records is the key benefit of probabilistic linkage, as we have a measure of similarity of the records (rather than a binary link/no-link). However, we need to choose a threshold at or above which links are considered valid in order to generate our final linked data (clusters).
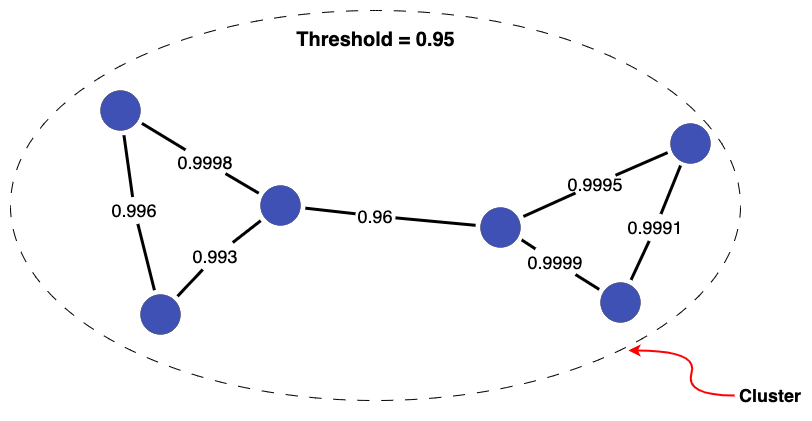
Let's consider a few different thresholds for the records above to see how the resulting clusters change. Setting a threshold of 0.95 keeps all links, so the records are all joined up into a single cluster.
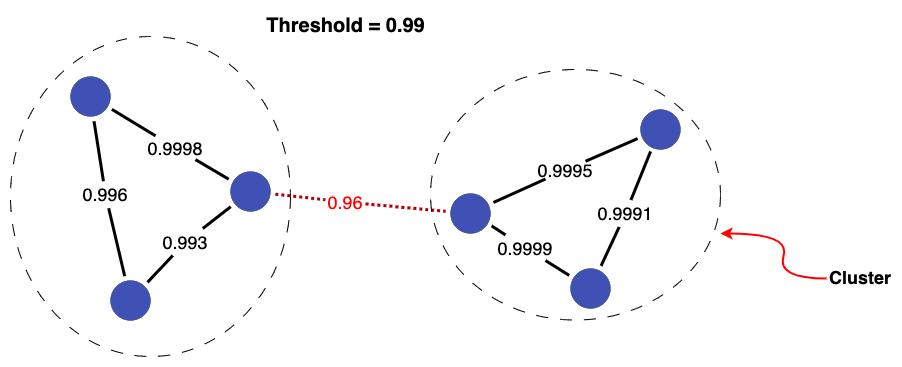
Whereas if we increase the threshold to 0.99, one link is discarded. This breaks the records into two clusters.
Increasing the threshold further (to 0.999) breaks an additional two links, resulting in a total of three clusters.
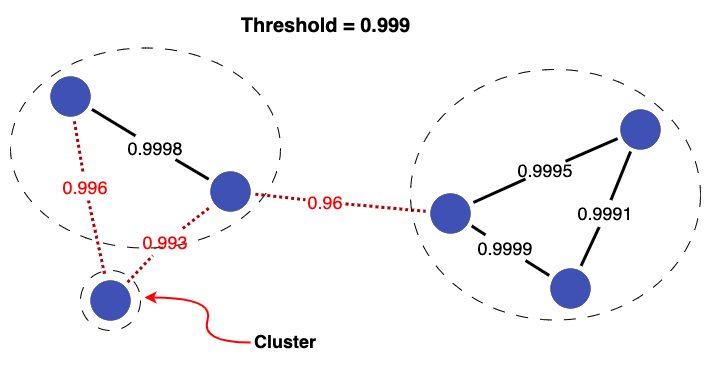
This demonstrates that choice of threshold can have a significant impact on the final linked data produced (i.e. clusters). For more specific guidance on selecting linkage thresholds, check out the Evaluation Topic Guides.