Charts in Splink
Interactive charts are a key tool when linking data with Splink. To see all of the charts available, check out the Splink Charts Gallery.
How do charts work in Splink?
Charts in Splink are built with Altair.
For a given chart, there is usually:
- A template chart definition (e.g.
match_weights_waterfall.json) - A function to create the dataset for the chart (e.g.
records_to_waterfall_data) - A function to read the chart definition, add the data to it, and return the chart itself (e.g.
waterfall_chart)
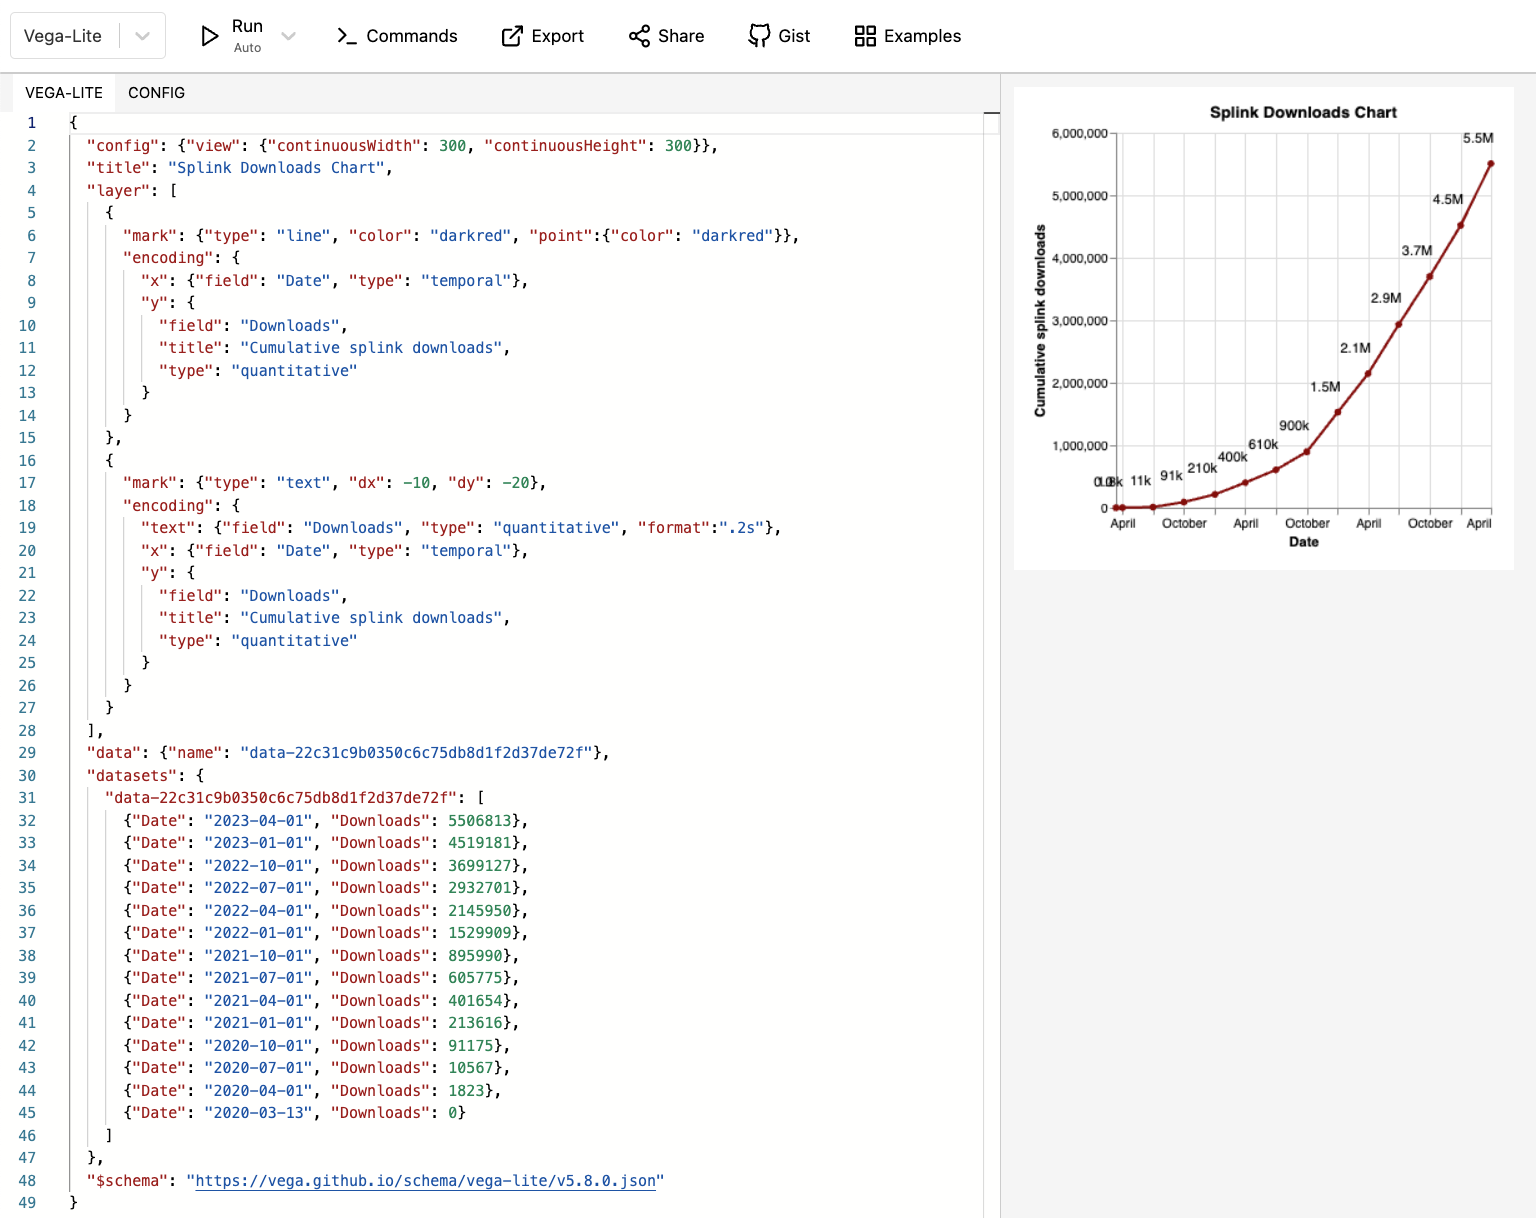
The Vega-Lite Editor
By far the best feature of Vega-Lite is the online editor where the JSON schema and the chart are shown side-by-side, showing changes in real time as the editor helps you to navigate the API.
Editing existing charts
If you take any Altair chart in HTML format, you should be able to make changes pretty easily with the Vega-Lite Editor.
For example, consider the comparator_score_chart from the similarity analysis library:
| Before | After |
|---|---|
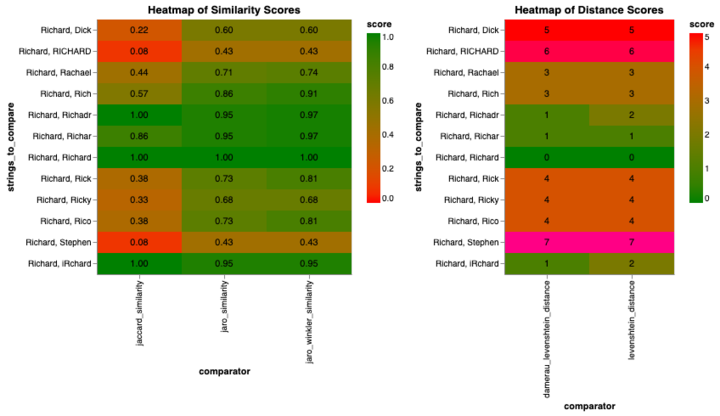 |
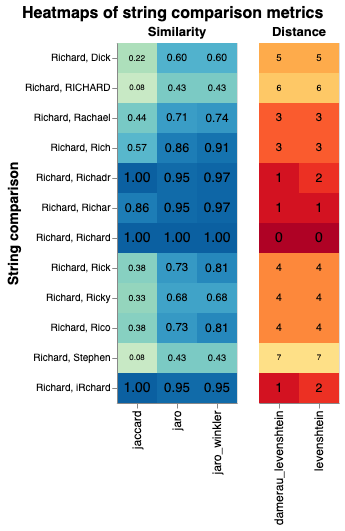 |
Desired changes
- Titles (shared title)
- Axis titles
- Shared y-axis
- Colour scales!! 🤮 (see the Vega colour schemes docs)
- red-green is an accessibility no-no
- shared colour scheme for different metrics
- unpleasant and unclear to look at
- legends not necessary (especially when using text labels)
- Text size encoding (larger text for similar strings)
- Remove "_similarity" and "_distance" from column labels
- Fixed column width (rather than chart width)
- Row highlighting (on click/hover)
The old spec can be pasted into the Vega Lite editor and edited as shown in the video below:
Check out the final, improved version chart specification.
Before-After diff
@@ -1,9 +1,8 @@
{
-  "config": {
-    "view": {
-      "continuousWidth": 400,
-      "continuousHeight": 300
-    }
+  "title": {
+    "text": "Heatmaps of string comparison metrics",
+    "anchor": "middle",
+    "fontSize": 16
  },
  "hconcat": [
    {
@@ -18,25 +17,32 @@
                  0,
                  1
                ],
-                "range": [
-                  "red",
-                  "green"
-                ]
+                "scheme": "greenblue"
              },
-              "type": "quantitative"
+              "type": "quantitative",
+              "legend": null
            },
            "x": {
              "field": "comparator",
-              "type": "ordinal"
+              "type": "ordinal",
+              "title": null
            },
            "y": {
              "field": "strings_to_compare",
-              "type": "ordinal"
+              "type": "ordinal",
+              "title": "String comparison",
+              "axis": {
+                "titleFontSize": 14
+              }
            }
          },
-          "height": 300,
-          "title": "Heatmap of Similarity Scores",
-          "width": 300
+          "title": "Similarity",
+          "width": {
+            "step": 40
+          },
+          "height": {
+            "step": 30
+          }
        },
        {
          "mark": {
@@ -44,6 +50,16 @@
            "baseline": "middle"
          },
          "encoding": {
+            "size": {
+              "field": "score",
+              "scale": {
+                "range": [
+                  8,
+                  14
+                ]
+              },
+              "legend": null
+            },
            "text": {
              "field": "score",
              "format": ".2f",
@@ -51,7 +67,10 @@
            },
            "x": {
              "field": "comparator",
-              "type": "ordinal"
+              "type": "ordinal",
+              "axis": {
+                "labelFontSize": 12
+              }
            },
            "y": {
              "field": "strings_to_compare",
@@ -72,29 +91,33 @@
            "color": {
              "field": "score",
              "scale": {
-                "domain": [
-                  0,
-                  5
-                ],
-                "range": [
-                  "green",
-                  "red"
-                ]
+                "scheme": "yelloworangered",
+                "reverse": true
              },
-              "type": "quantitative"
+              "type": "quantitative",
+              "legend": null
            },
            "x": {
              "field": "comparator",
-              "type": "ordinal"
+              "type": "ordinal",
+              "title": null,
+              "axis": {
+                "labelFontSize": 12
+              }
            },
            "y": {
              "field": "strings_to_compare",
-              "type": "ordinal"
+              "type": "ordinal",
+              "axis": null
            }
          },
-          "height": 300,
-          "title": "Heatmap of Distance Scores",
-          "width": 200
+          "title": "Distance",
+          "width": {
+            "step": 40
+          },
+          "height": {
+            "step": 30
+          }
        },
        {
          "mark": {
@@ -102,6 +125,17 @@
            "baseline": "middle"
          },
          "encoding": {
+            "size": {
+              "field": "score",
+              "scale": {
+                "range": [
+                  8,
+                  14
+                ],
+                "reverse": true
+              },
+              "legend": null
+            },
            "text": {
              "field": "score",
              "type": "quantitative"
@@ -124,7 +158,9 @@
  ],
  "resolve": {
    "scale": {
-      "color": "independent"
+      "color": "independent",
+      "y": "shared",
+      "size": "independent"
    }
  },
  "$schema": "https://vega.github.io/schema/vega-lite/v4.17.0.json",