parameter_estimate_comparisons_chart
At a glance
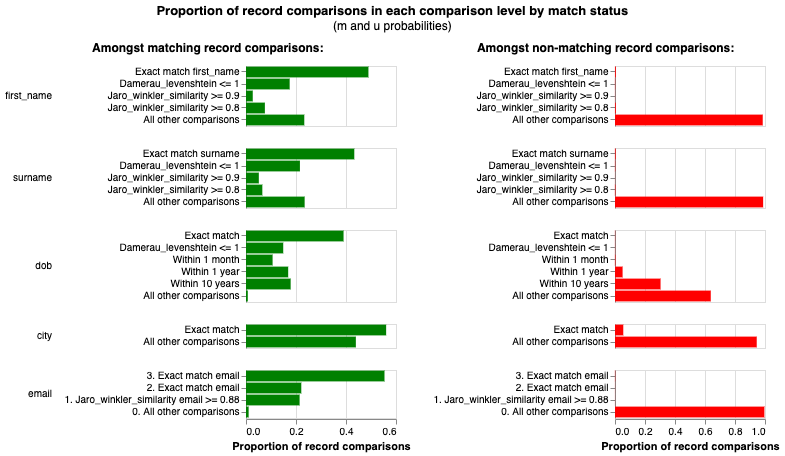
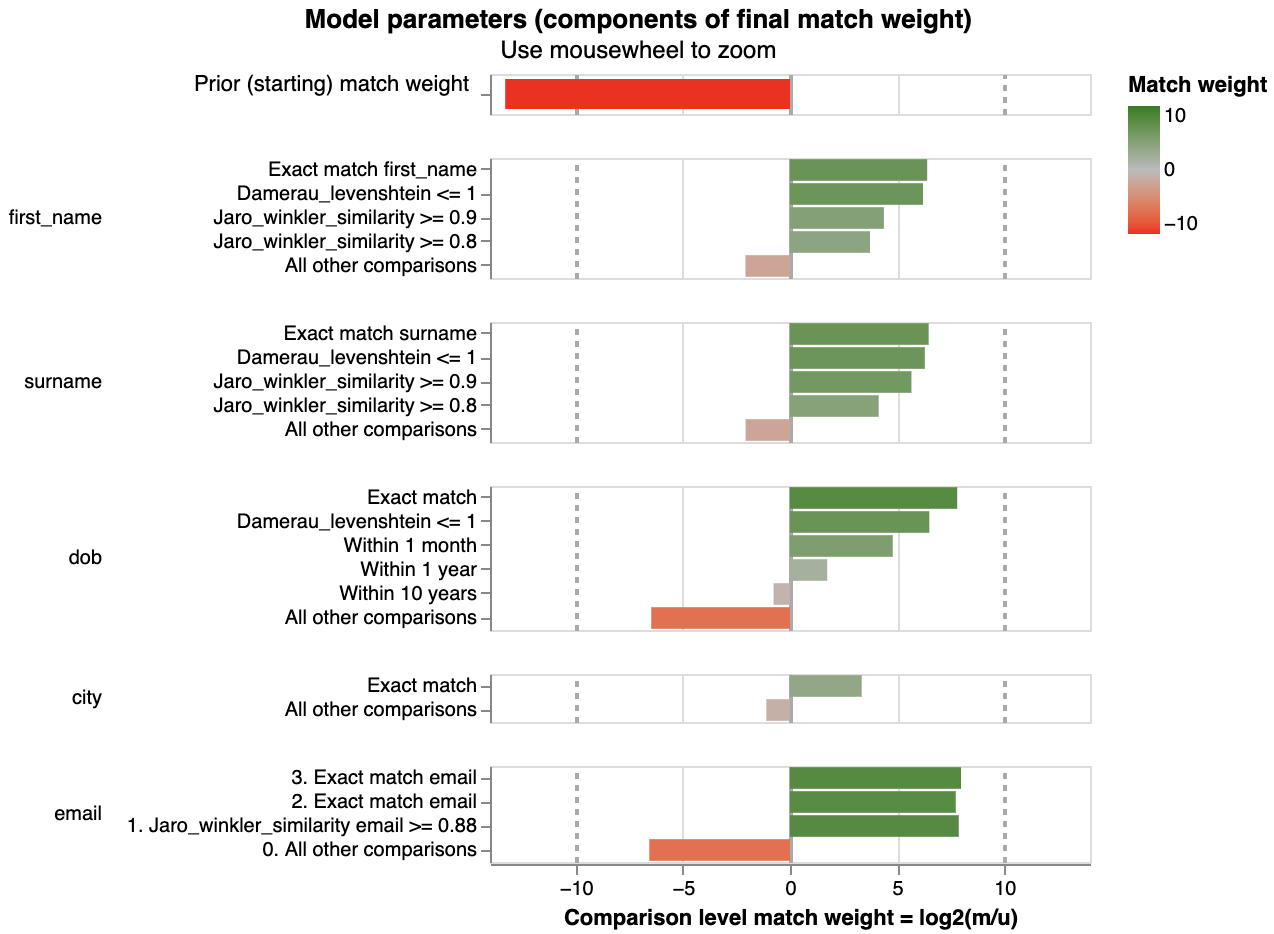
Useful for: Looking at the m and u value estimates across multiple Splink model training sessions.
API Documentation: parameter_estimate_comparisons_chart()
What is needed to generate the chart? A trained Splink model.
Related Charts
Worked Example
import splink.comparison_library as cl
from splink import DuckDBAPI, Linker, SettingsCreator, block_on, splink_datasets

df = splink_datasets.fake_1000

settings = SettingsCreator(
    link_type="dedupe_only",
    comparisons=[
        cl.JaroWinklerAtThresholds("first_name", [0.9, 0.7]),
        cl.JaroAtThresholds("surname", [0.9, 0.7]),
        cl.DateOfBirthComparison(
            "dob",
            input_is_string=True,
            datetime_metrics=["year", "month"],
            datetime_thresholds=[1, 1],
        ),
        cl.ExactMatch("city").configure(term_frequency_adjustments=True),
        cl.EmailComparison("email"),
    ],
    blocking_rules_to_generate_predictions=[
        block_on("first_name"),
        block_on("surname"),
    ],
)

linker = Linker(df, settings, DuckDBAPI())
linker.training.estimate_u_using_random_sampling(max_pairs=1e6)

blocking_rule_for_training = block_on("first_name", "surname")
linker.training.estimate_parameters_using_expectation_maximisation(
    blocking_rule_for_training
)

blocking_rule_for_training = block_on("dob")
linker.training.estimate_parameters_using_expectation_maximisation(
    blocking_rule_for_training
)

blocking_rule_for_training = block_on("email")
linker.training.estimate_parameters_using_expectation_maximisation(
    blocking_rule_for_training
)

chart = linker.visualisations.parameter_estimate_comparisons_chart()
chart