Edge Metrics
This guide is intended to be a reference guide for Edge Metrics used throughout Splink. It will build up from basic principles into more complex metrics.
Note
All of these metrics are dependent on having a "ground truth" to compare against. This is generally provided by Clerical Labelling (i.e. labels created by a human). For more on how to generate this ground truth (and the impact that can have on Edge Metrics), check out the Clerical Labelling Topic Guide.
The Basics
Any Edge (Link) within a Splink model will fall into one of four categories:
True Positive
Also known as: True Link
A True Positive is a case where a Splink model correctly predicts a match between two records.
True Negative
Also known as: True Non-link
A True Negative is a case where a Splink model correctly predicts a non-match between two records.
False Positive
Also known as: False Link, Type I Error
A False Positive is a case where a Splink model incorrectly predicts a match between two records, when they are actually a non-match.
False Negative
Also known as: False Non-link, Missed Link, Type II Error
A False Negative is a case where a Splink model incorrectly predicts a non-match between two records, when they are actually a match.
Confusion Matrix
These can be summarised in a Confusion Matrix
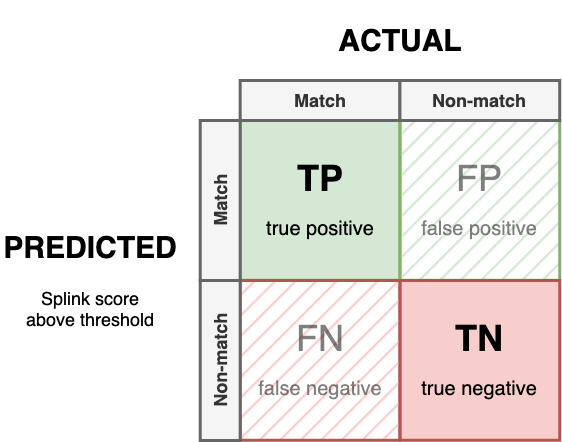
In a perfect model there would be no False Positives or False Negatives (i.e. FP = 0 and FN = 0).
Metrics for Linkage
The confusion matrix shows counts of each link type, but we are generally more interested in proportions. I.e. what percentage of the time does the model get the answer right?
Accuracy
The simplest metric is
This measures the proportion of correct classifications (of any kind). This may be useful for balanced data but high accuracy can be achieved by simply assuming the majority class for highly imbalanced data (e.g. assuming non-matches).
Accuracy in Splink
- Accuracy can be calculated in Splink using the
accuracy_analysis_from_labels_columnandaccuracy_analysis_from_labels_table methods. Checkout thesplink.evaluationdocs for more.
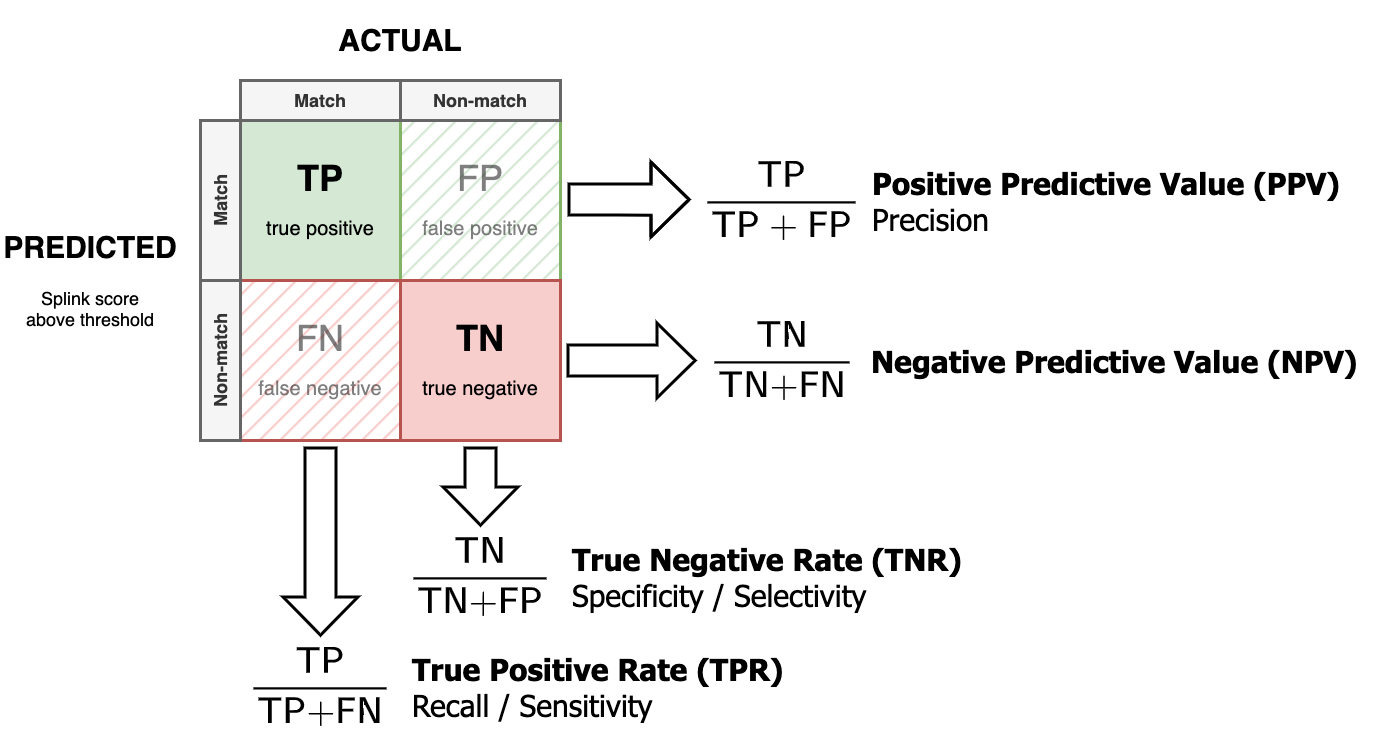
True Positive Rate (Recall)
Also known as: Sensitivity
The True Positive Rate (Recall) is the proportion of matches that are correctly predicted by Splink.
Recall in Splink
- Recall can be calculated in Splink using the
accuracy_analysis_from_labels_columnandaccuracy_analysis_from_labels_table methods. Checkout thesplink.evaluationdocs for more.
True Negative Rate (Specificity)
Also known as: Selectivity
The True Negative Rate (Specificity) is the proportion of non-matches that are correctly predicted by Splink.
Specificity in Splink
- Specificity can be calculated in Splink using the
accuracy_analysis_from_labels_columnandaccuracy_analysis_from_labels_table methods. Checkout thesplink.evaluationdocs for more.
Positive Predictive Value (Precision)
The Positive Predictive Value (Precision), is the proportion of predicted matches which are true matches.
Precision in Splink
- Precision can be calculated in Splink using the
accuracy_analysis_from_labels_columnandaccuracy_analysis_from_labels_table methods. Checkout thesplink.evaluationdocs for more.
Negative Predictive Value
The Negative Predictive Value is the proportion of predicted non-matches which are true non-matches.
Negative Predictive Value in Splink
- Negative predictive value can be calculated in Splink using the
accuracy_analysis_from_labels_columnandaccuracy_analysis_from_labels_table methods. Checkout thesplink.evaluationdocs for more.
Warning
Each of these metrics looks at just one row or column of the confusion matrix. A model cannot be meaningfully summarised by just one of these performance measures.
“Predicts cancer with 100% Precision” - is true of a “model” that correctly identifies one known cancer patient, but misdiagnoses everyone else as cancer-free.
“AI judge’s verdicts have Recall of 100%” - is true for a power-mad AI judge that declares everyone guilty, regardless of any evidence to the contrary.
Composite Metrics for Linkage
This section contains composite metrics i.e. combinations of metrics that can been derived from the confusion matrix (Precision, Recall, Specificity and Negative Predictive Value).
Any comparison of two records has a number of possible outcomes (True Positives, False Positives etc.), each of which has a different impact on your specific use case. It is very rare that a single metric defines the desired behaviour of a model. Therefore, evaluating performance with a composite metric (or a combination of metrics) is advised.
F Score
The F-Score is a weighted harmonic mean of Precision (Positive Predictive Value) and Recall (True Positive Rate). For a general weight \(\beta\):
where Recall is \(\beta\) times more important than Precision.
For example, when Precision and Recall are equally weighted (\(\beta = 1\)), we get:
Other popular versions of the F score are \(F_{2}\) (Recall twice as important as Precision) and \(F_{0.5}\) (Precision twice as important as Recall)
F-Score in Splink
- The F score can be calculated in Splink using the
accuracy_analysis_from_labels_columnandaccuracy_analysis_from_labels_table methods. Checkout thesplink.evaluationdocs for more.
Warning
F-score does not account for class imbalance in the data, and is asymmetric (i.e. it considers the prediction of matching records, but ignores how well the model correctly predicts non-matching records).
P4 Score
The \(P_{4}\) Score is the harmonic mean of the 4 metrics that can be directly derived from the confusion matrix:
This addresses one of the issues with the F-Score as it considers how well the model predicts non-matching records as well as matching records.
Note: all metrics are given equal weighting.
\(P_{4}\) in Splink
- \(P_{4}\) can be calculated in Splink using the
accuracy_analysis_from_labels_columnandaccuracy_analysis_from_labels_table methods. Checkout thesplink.evaluationdocs for more.
Matthews Correlation Coefficient
The Matthews Correlation Coefficient (\(\phi\)) is a measure of how correlation between predictions and actual observations.
Matthews Correlation Coefficient (\(\phi\)) in Splink
- \(\phi\) be calculated in Splink using the
accuracy_analysis_from_labels_columnandaccuracy_analysis_from_labels_table methods. Checkout thesplink.evaluationdocs for more.
Note
Unlike the other metrics in this guide, \(\phi\) is a correlation coefficient, so can range from -1 to 1 (as opposed to a range of 0 to 1).
In reality, linkage models should never be negatively correlated with actual observations, so \(\phi\) can be used in the same way as other metrics.